The market outlook for new crop cotton is focused on early seasonal indicators of potential production, such as planted acreage and soil moisture. Other potential influences on supply, ultimately uncertain, could come into play in 2019. There are also numerous and uncertain influences on the demand side, such as the recognition that China’s demand for imports may increase.
All of these moving parts can make the price outlook seem more complicated than it is. The basic predictor of cotton prices is whether ending stocks (or carryover stocks) are increasing or decreasing. When ending stocks are increasing compared to the previous marketing year, we expect the range of prices to be lower than during the previous marketing year.
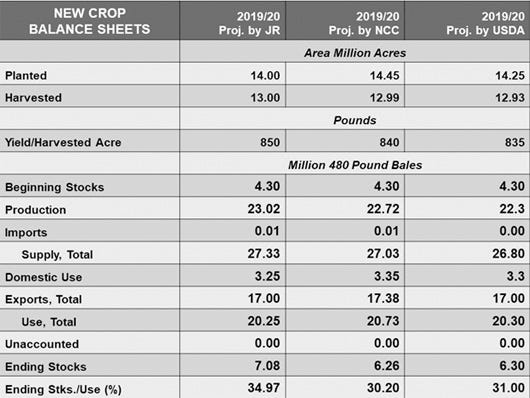
The traditional way of presenting commodity supply and demand information is in a balance sheet (Table 1).
The supply variables are presented first, with total supply being the sum of carry-in from the last marketing year, imports (usually negligible), and production. The demand variables include domestic mill use and exports. There is a fudge factor to account for supplies that are lost in transit, and also to help create nice round number totals.
FUNDAMENTAL PRICE PREDICTOR
The bottom line of the balance sheet is ending stocks, which is total supply less total consumption. It is easy to get lost in all the numbers, but just focus on ending stocks. The year-over-year direction of ending stocks is the fundamental predictor of prices.
For example, during 2017/18 and 2018/19, ICE cotton futures spent most of their time trading between 70 cents and 85 cents. These price outcomes were associated with ending stocks of 4.3 million bales in both of these two marketing years.
Now look at projected new crop ending stocks for the 2019/20 marketing year. Table 1 gives three somewhat similar estimates. They all suggest that new crop ending stocks could increase by at least a third over the level of the previous two years. That suggests that the range of new crop prices will be lower over the 2019/20 marketing year. As a result, I think it’s possible to see Dec’19 futures trading between the upper 70s and lower 60s.
EL NIÑO IMPACT
Why are there differences among the balance sheet projections in Table 1? Some of the differences are related to different assumptions about yield and abandonment. For example, my projections in Column 2 assume lower abandonment and higher yields because I averaged observations only from wetter El Niño years. The other two projections included more observations from non-El Niño years. With NOAA forecasting an extended El Niño condition, it makes more sense to me to develop my yield and abandonment expectations conditioned on El Niño year observations.
Similarly, the differences in U.S. exports can be explained by assumptions of resolution of the U.S.-China tariff conflict (NCC) or the status quo (USDA). We have to live with such assumptions until we can replace them with harder data.
For additional thoughts on these and other cotton marketing topics, please visit my weekly online newsletter at http://agrilife.org/cottonmarketing/
Table 1. 2019/20 U.S. Cotton Balance Sheet Projections by the Author, the National Cotton Council (c. February 9), and USDA (c. February 22).

About the Author(s)
You May Also Like


