

Hudbay Provides Annual Reserve and Resource Update
- 41%i increase in Lalor’s life-of-mine gold production from the previous mine plan, including an increase in average annual gold production to over 150,000 ounces during the first eight years of New Britannia production at the lowest quartile all-in sustaining cost globallyii
- 35% increase in total Snow Lake gold reserves to 2.2 million ounces, supporting an 18-year mine life for the Snow Lake operations
- Successful exploration efforts at Lalor and in the Snow Lake region added to the mineral resource inventory and offset the conversion of mineral resources to reserves; initial inferred resource estimates announced for high-grade copper-gold Lens 17 at Lalor and nearby Watts base metal deposit
- Recent drilling intersections north of the Constancia open pit highlight the potential for porphyry copper and high-grade skarn mineralization within the limit of the currently permitted mining areas
- Community agreement reached on two targets located southwest of Constancia; continuing to advance community relations and technical activities on other regional properties near Constancia
- Conducted strategic land consolidation near the Mason project, including a large package of claims hosting potential for high-grade skarn deposits
/EIN News/ -- TORONTO, March 30, 2020 (GLOBE NEWSWIRE) -- Hudbay Minerals Inc. (“Hudbay” or the “company”) (TSX, NYSE: HBM) today provided an update on its annual mineral reserve and resource estimates and exploration activities. All dollar amounts are in US dollars, unless otherwise noted.
“We are extremely pleased with our exploration success over the past 12 months in Manitoba where we’ve doubled the mine life in Snow Lake and more than doubled Lalor’s annual gold production from current levels,” said Peter Kukielski, Hudbay’s President and Chief Executive Officer. “In addition to replacing the ore that was mined at Constancia last year, we are also encouraged by recent drilling results north of the Constancia pit where high-grade skarn mineralization has been intersected. Hudbay has a proven track record of delivering value through the drill bit and successfully extending the life of our mines, demonstrating one of the many ways we can leverage our core competencies to create value.”
Lalor Mine and Snow Lake Operations
Phase One of Snow Lake Gold Strategy
In February 2019, Hudbay announced the results from its first phase of its Snow Lake gold strategy which repositioned Lalor as a gold mine with precious metals contributing a majority of the life-of-mine revenues. The first phase resulted in a 65% increase in Lalor’s gold reserves and was the first mine plan that included the processing of gold and copper-gold ore at the company’s New Britannia mill. Several years of detailed work was completed in advance of the phase one mine plan, including significant drilling and test mining of the Lalor gold and copper-gold zones, and trade-off studies on the various processing solutions for the gold ore. The New Britannia mill was determined to be the optimal processing solution for Lalor gold, as it capitalizes on existing infrastructure and is expected to achieve gold recoveries of approximately 93% compared to the current gold recoveries of approximately 53% at the Stall mill. The phase one gold mine plan contemplated Lalor’s annual gold production more than doubling from then current levels to approximately 140,000 ounces over the first five years once the New Britannia mill is refurbished.
Phase Two of Snow Lake Gold Strategy
Over the last 12 months, the company has executed on the second phase of its Snow Lake gold strategy, focusing on extensive infill and exploration drilling at Lalor and advancing engineering studies on the regional deposits in Snow Lake. This has resulted in a significant increase in the mineral reserves and mineral resources for Lalor and the nearby satellite deposits, including a 35% increase in total Snow Lake gold reserves to 2.2 million ounces. Lalor’s current reserve estimate has added more than a year to its mine life, and with the inclusion of the reserves at the nearby satellite deposits, the mine life of the Snow Lake operations now totals 18 years. Based on the updated reserve, Lalor’s life-of-mine gold production increased by 41%i compared to the previous mine plan, and annual gold production is expected to average greater than 150,000 ounces over the first eight years after the New Britannia mill is refurbished, which is more than double the current annual gold production from Lalor and 9%iii higher than the previous mine plan. Lalor will remain a low-cost gold mine with sustaining cash costsiv, net of by-product credits, of approximately $655 per ounce over the first eight years once New Britannia is in production, positioning Lalor in the lowest quartile on the global all-in sustaining cost curve.
The revised 18-year mine plan for the Snow Lake operations utilizes the existing mining capacity of up to 4,500 tonnes per day at the Lalor mine for the first ten years followed by the mining of the gold-rich WIM and 3 Zone deposits for the last eight years of the mine plan. Please refer to Figure 1 for a map outlining the location of the various Snow Lake deposits within trucking distance of the New Britannia mill and other regional infrastructure.
Under the revised mine plan, the New Britannia gold mill will operate at its maximum capacity of 1,500 tonnes per day from 2022 to 2030 by processing Lalor’s current reserves at average grades of 6.4 grams per tonne gold and 1.0% copper. From 2030 to 2037, New Britannia is expected to operate at a processing rate between 1,200 to 1,500 tonnes per day at average grades of 2.2 grams per tonne gold and 1.3% copper, as the Lalor feed is replaced by WIM and 3 Zone (see “Snow Lake Mine Plan” below).
The WIM deposit was acquired by Hudbay in the third quarter of 2018 for approximately C$0.5 million. WIM is a copper-gold deposit that starts from surface, is expected to be developed via an underground ramp and is located approximately 15 kilometres by road from New Britannia. The 3 Zone deposit was acquired by Hudbay as part of the acquisition of the New Britannia mine and mill. 3 Zone is a ramp-access deposit located within the existing mining infrastructure at the past producing New Britannia mine.
The New Britannia mill development plan contemplates construction activities occurring between June 2020 and August 2021, with plant commissioning and ramp-up occurring during the fourth quarter of 2021. This timing assumes no delays or deferrals due to the impact of the COVID-19 coronavirus or related liquidity considerations, which remains a risk we continue to prudently assess and monitor. All key environmental permits for the project have been obtained.
Snow Lake Mine Plan
| 2020 | 2021 | 2022 | 2023 | 2024 | 2025 | 2026 | 2027 | 2028 | 2029 | 2030 | LOM | ||||||||||||||
| Lalor Base Metal Ore | |||||||||||||||||||||||||
| Ore Mined | tonnes (000s) |
1,575 | 1,506 | 1,035 | 997 | 1,035 | 1,035 | 1,035 | 738 | 521 | 518 | 176 | 10,170 | ||||||||||||
| Ore Mined | tpd | 4,351 | 4,160 | 2,859 | 2,754 | 2,859 | 2,859 | 2,859 | 2,038 | 1,438 | 1,431 | 485 | - | ||||||||||||
| Cu Grade | % Cu | 0.64 | % | 0.65 | % | 0.61 | % | 0.57 | % | 0.60 | % | 0.55 | % | 0.61 | % | 0.63 | % | 0.73 | % | 0.75 | % | 0.29 | % | 0.62 | % |
| Zn Grade | % Zn | 5.60 | % | 5.36 | % | 5.74 | % | 5.67 | % | 4.51 | % | 5.01 | % | 5.65 | % | 4.78 | % | 4.83 | % | 4.19 | % | 5.70 | % | 5.25 | % |
| Au Grade | g/t Au | 2.55 | 3.28 | 2.72 | 2.86 | 2.70 | 2.76 | 3.86 | 3.83 | 3.91 | 3.75 | 1.51 | 3.08 | ||||||||||||
| Ag Grade | g/t Ag | 26.68 | 28.21 | 31.38 | 30.84 | 26.34 | 32.34 | 33.37 | 30.55 | 23.55 | 25.77 | 21.62 | 29.00 | ||||||||||||
| Lalor Gold Ore | |||||||||||||||||||||||||
| Ore Mined | tonnes (000s) |
- | 69 | 540 | 540 | 540 | 540 | 540 | 540 | 537 | 540 | 459 | 4,845 | ||||||||||||
| Ore Mined | tpd | - | 191 | 1,492 | 1,492 | 1,492 | 1,492 | 1,492 | 1,492 | 1,484 | 1,492 | 1,267 | - | ||||||||||||
| Cu Grade | % Cu | - | 1.12 | % | 0.81 | % | 0.99 | % | 0.91 | % | 0.83 | % | 0.83 | % | 0.85 | % | 1.55 | % | 1.54 | % | 0.62 | % | 1.00 | % | |
| Zn Grade | % Zn | - | 0.38 | % | 0.48 | % | 0.92 | % | 0.78 | % | 0.35 | % | 0.62 | % | 0.95 | % | 0.63 | % | 0.47 | % | 0.69 | % | 0.65 | % | |
| Au Grade | g/t Au | - | 5.83 | 6.62 | 6.19 | 5.33 | 6.42 | 7.37 | 5.41 | 6.70 | 6.71 | 7.15 | 6.41 | ||||||||||||
| Ag Grade | g/t Ag | - | 20.69 | 26.67 | 22.08 | 24.37 | 23.52 | 32.91 | 26.54 | 29.33 | 26.66 | 28.24 | 26.59 | ||||||||||||
| Total Ore - Lalor | |||||||||||||||||||||||||
| Ore Mined | tonnes (000s) |
1,575 | 1,575 | 1,575 | 1,537 | 1,575 | 1,575 | 1,575 | 1,278 | 1,058 | 1,058 | 634 | 15,015 | ||||||||||||
| Ore Mined | tpd | 4,351 | 4,351 | 4,351 | 4,246 | 4,351 | 4,351 | 4,351 | 3,530 | 2,923 | 2,923 | 1,753 | - | ||||||||||||
| Cu Grade | % Cu | 0.64 | % | 0.67 | % | 0.68 | % | 0.72 | % | 0.71 | % | 0.65 | % | 0.68 | % | 0.72 | % | 1.15 | % | 1.15 | % | 0.53 | % | 0.74 | % |
| Zn Grade | % Zn | 5.60 | % | 5.14 | % | 3.94 | % | 4.00 | % | 3.23 | % | 3.41 | % | 3.93 | % | 3.16 | % | 2.70 | % | 2.29 | % | 2.08 | % | 3.77 | % |
| Au Grade | g/t Au | 2.55 | 3.39 | 4.06 | 4.03 | 3.60 | 4.02 | 5.06 | 4.50 | 5.33 | 5.26 | 5.58 | 4.16 | ||||||||||||
| Ag Grade | g/t Ag | 26.68 | 27.88 | 29.77 | 27.76 | 25.66 | 29.31 | 33.21 | 28.85 | 26.49 | 26.22 | 26.41 | 28.22 | ||||||||||||
| 2030 | 2031 | 2032 | 2033 | 2034 | 2035 | 2036 | 2037 | LOM | |||||||||||
| WIM Ore | |||||||||||||||||||
| Ore Mined | tonnes (000s) |
104 | 414 | 438 | 438 | 401 | 316 | 288 | 49 | 2,448 | |||||||||
| Ore Mined | tpd | 286 | 1,133 | 1,200 | 1,200 | 1,100 | 867 | 788 | 134 | - | |||||||||
| Cu Grade | % Cu | 1.22 | % | 1.62 | % | 1.47 | % | 1.72 | % | 1.71 | % | 1.71 | % | 1.67 | % | 1.70 | % | 1.63 | % |
| Zn Grade | % Zn | 0.09 | % | 0.18 | % | 0.32 | % | 0.42 | % | 0.28 | % | 0.17 | % | 0.13 | % | 0.13 | % | 0.25 | % |
| Au Grade | g/t Au | 0.76 | 1.24 | 1.55 | 1.74 | 1.82 | 1.82 | 1.68 | 1.87 | 1.60 | |||||||||
| Ag Grade | g/t Ag | 4.64 | 6.01 | 5.66 | 6.51 | 6.67 | 6.92 | 6.76 | 6.86 | 6.31 | |||||||||
| 3 Zone Ore | |||||||||||||||||||
| Ore Mined | tonnes (000s) |
- | - | - | - | 38 | 219 | 219 | 187 | 662 | |||||||||
| Ore Mined | tpd | - | - | - | - | 103 | 600 | 600 | 511 | - | |||||||||
| Cu Grade | % Cu | - | - | - | - | - | - | - | - | - | |||||||||
| Zn Grade | % Zn | - | - | - | - | - | - | - | - | - | |||||||||
| Au Grade | g/t Au | 3.40 | 4.17 | 4.17 | 4.46 | 4.21 | |||||||||||||
| Ag Grade | g/t Ag | - | - | - | - | - | - | - | - | - | |||||||||
| Total Ore - Satellite Deposits | |||||||||||||||||||
| Ore Mined | tonnes (000s) |
104 | 414 | 438 | 438 | 438 | 535 | 507 | 235 | 3,110 | |||||||||
| Ore Mined | tpd | 286 | 1,133 | 1,200 | 1,200 | 1,203 | 1,467 | 1,389 | 645 | - | |||||||||
| Cu Grade | % Cu | 1.22 | % | 1.62 | % | 1.47 | % | 1.72 | % | 1.56 | % | 1.01 | % | 0.95 | % | 0.35 | % | 1.28 | % |
| Zn Grade | % Zn | 0.09 | % | 0.18 | % | 0.32 | % | 0.42 | % | 0.26 | % | 0.10 | % | 0.07 | % | 0.03 | % | 0.20 | % |
| Au Grade | g/t Au | 0.76 | 1.24 | 1.55 | 1.74 | 1.96 | 2.78 | 2.76 | 3.93 | 2.15 | |||||||||
| Ag Grade | g/t Ag | 4.64 | 6.01 | 5.66 | 6.51 | 6.10 | 4.09 | 3.84 | 1.42 | 4.97 | |||||||||
Note: Tonnes per day (“tpd”) assumes 365 operating days a year. LOM refers to life-of-mine.
Snow Lake Metallurgical Recoveries
| LOM Average | ||
| Base Metal Ore Through Stall | ||
| Average Lalor Ore Recoveries | ||
| Cu | 83.6 | % |
| Au | 52.9 | % |
| Ag | 53.3 | % |
| Zn | 93.2 | % |
| Gold Ore Through New Britannia | ||
| Average Lalor Ore Recoveries | ||
| Cu | 93.9 | % |
| Au | 93.3 | % |
| Ag | 77.8 | % |
| Average WIM Ore Recoveries | ||
| Cu | 97.7 | % |
| Au | 88.4 | % |
| Ag | 69.8 | % |
| Average 3 Zone Ore Recoveries | ||
| Au | 85.0 | % |
Snow Lake Production Profile
|
Lalor Mine Production |
2020 | 2021 | 2022 | 2023 | 2024 | 2025 | 2026 | 2027 | 2028 | 2029 | 2030 | LOM | |
| Cu | tonnes (000s) | 8 | 9 | 9 | 10 | 10 | 9 | 9 | 8 | 11 | 11 | 3 | 97 |
| Zn | tonnes (000s) | 81 | 74 | 55 | 52 | 43 | 48 | 54 | 32 | 23 | 20 | 9 | 492 |
| Au | ounces (000s) | 74 | 102 | 158 | 151 | 136 | 154 | 192 | 139 | 146 | 146 | 103 | 1,501 |
| Ag | ounces (000s) | 783 | 829 | 956 | 851 | 828 | 914 | 1,087 | 778 | 665 | 625 | 382 | 8,698 |
|
WIM Mine Production |
2030 | 2031 | 2032 | 2033 | 2034 | 2035 | 2036 | 2037 | LOM | |
| Cu | tonnes (000s) | 1 | 7 | 6 | 7 | 7 | 5 | 5 | 1 | 39 |
| Zn | tonnes (000s) | - | - | - | - | - | - | - | - | - |
| Au | ounces (000s) | 2 | 14 | 19 | 22 | 21 | 17 | 14 | 3 | 110 |
| Ag | ounces (000s) | 10 | 56 | 54 | 65 | 61 | 50 | 44 | 8 | 347 |
|
3 Zone Mine Production |
2030 | 2031 | 2032 | 2033 | 2034 | 2035 | 2036 | 2037 | LOM | |
| Cu | tonnes (000s) | - | - | - | - | - | - | - | - | - |
| Zn | tonnes (000s) | - | - | - | - | - | - | - | - | - |
| Au | ounces (000s) | - | - | - | - | 3 | 25 | 25 | 23 | 76 |
| Ag | ounces (000s) | - | - | - | - | - | - | - | - | - |
Note: Production includes metal contained in concentrate and doré.
Snow Lake Unit Operating Costs and Cash Costs
| Unit Operating Costs | LOM Average | ||
| Mining – Lalor | C$/tonne | $ | 110.20 |
| Mining – WIM | C$/tonne | $ | 73.44 |
| Mining – 3 Zone | C$/tonne | $ | 68.41 |
| Milling – Stall | C$/tonne | $ | 28.01 |
| Milling – New Britannia | C$/tonne | $ | 39.01 |
Note:
- Unit operating costs exclude general and administrative costs related to shared services incurred in Flin Flon and allocated between 777 and Lalor mines.
- Mining costs include costs to truck approximately 1,000 tonnes per day from Lalor to Flin Flon until New Britannia is operating in 2022.
| Gold Cash Costs | 2020 | 2021 | 2022 | 2023 | 2024 | 2025 | 2026 | 2027 | 2028 | 2029 | 2022-2029 Avg. | |||||||||||||
| Gold Production | ounces (000s) |
74 | 102 | 158 | 151 | 136 | 154 | 192 | 139 | 146 | 146 | 153 | ||||||||||||
| Cash Costs | US$/oz | $ | (95 | ) | $ | 151 | $ | 371 | $ | 507 | $ | 584 | $ | 524 | $ | 387 | $ | 624 | $ | 434 | $ | 456 | $ | 480 |
| Sustaining Cash Costs | US$/oz | $ | 966 | $ | 980 | $ | 848 | $ | 805 | $ | 882 | $ | 720 | $ | 460 | $ | 685 | $ | 443 | $ | 466 | $ | 657 | |
| 2030 | 2031 | 2032 | 2033 | 2034 | 2035 | 2036 | 2037 | 2030-2037 Avg. | LOM Avg. | |||||||||||||||
| Gold Production | ounces (000s) |
105 | 14 | 19 | 22 | 24 | 41 | 39 | 25 | 36 | 94 | |||||||||||||
| Cash Costs | US$/oz | $ | 669 | $ | 154 | $ | 309 | $ | 160 | $ | 212 | $ | 263 | $ | 312 | $ | 346 | $ | 410 | $ | 423 | |||
| Sustaining Cash Costs | US$/oz | $ | 815 | $ | 1,312 | $ | 855 | $ | 175 | $ | 709 | $ | 728 | $ | 583 | $ | 346 | $ | 700 | $ | 697 | |||
Note:
- Production includes metal contained in concentrate and doré.
- Cash costs include all onsite (mining, milling and general and administrative) and offsite costs associated with Lalor, WIM and 3 Zone and are reported net of by-product credits. By-product credits calculated using the following assumptions: zinc price (includes premium) of $1.18 per pound in 2020, $1.08 per pound in 2021 to 2023, $1.17 per pound long-term; copper price of $2.65 per pound in 2020, $3.00 per pound in 2021, $3.10 per pound in 2022 and long-term; silver price of $16.00 per ounce in 2020, $16.50 per ounce in 2021 to 2023, and $17.00 per ounce long-term; C$/US$ exchange rate of 1.30 for current and long-term.
- Sustaining cash costs incorporate all costs included in cash costs calculation plus sustaining capital expenditures.
- Cash costs and sustaining cash costs are non-IFRS financial performance measures with no standardized definition under IFRS. For further details on why Hudbay believes cash costs are a useful performance indicator, please refer to the Company's most recent Management's Discussion and Analysis for the year ended December 31, 2019.
Snow Lake Capital Expenditures
| Capital Expenditures | 2020 | 2021 | 2022 | 2023 | 2024 | 2025 | 2026 | 2027 | 2028 | 2029 | |||||||||||
| Sustaining Capital | |||||||||||||||||||||
| Lalor Sustaining Capital | C$ millions | $ | 102 | $ | 111 | $ | 98 | $ | 58 | $ | 53 | $ | 39 | $ | 18 | $ | 11 | $ | 2 | $ | 2 |
| Total Sustaining Capital | US$ millions | $ | 79 | $ | 85 | $ | 75 | $ | 45 | $ | 41 | $ | 30 | $ | 14 | $ | 8 | $ | 1 | $ | 1 |
| Growth Capital | |||||||||||||||||||||
| New Britannia Capital | C$ millions | $ | 105 | $ | 48 | - | - | - | - | - | - | - | - | ||||||||
| Total Growth Capital | US$ millions | $ | 80 | $ | 37 | - | - | - | - | - | - | - | - | ||||||||
| Capital Expenditures | 2029 | 2030 | 2031 | 2032 | 2033 | 2034 | 2035 | 2036 | 2037 | ||||||||||||
| Sustaining Capital | |||||||||||||||||||||
| WIM Sustaining Capital | C$ millions | - | $ | 20 | $ | 21 | $ | 13 | - | - | - | - | - | ||||||||
| 3 Zone Sustaining Capital | C$ millions | - | - | - | - | - | $ | 16 | $ | 25 | $ | 14 | - | ||||||||
| Total Sustaining Capital | US$ millions | - | $ | 15 | $ | 16 | $ | 10 | - | $ | 12 | $ | 19 | $ | 10 | - | |||||
| Growth Capital | |||||||||||||||||||||
| WIM Development | C$ millions | $ | 50 | - | - | - | - | - | - | - | - | ||||||||||
| 3 Zone Development | C$ millions | - | - | - | - | - | - | - | - | - | |||||||||||
| Total Growth Capital | US$ millions | $ | 39 | - | - | - | - | - | - | - | - | ||||||||||
Note: Totals may not add up correctly due to rounding. ”LOM” refers to life-of-mine. Canadian dollar capital expenditures converted to U.S. dollar capital expenditures at an exchange rate of 1.30 C$/US$.
Snow Lake Mineral Reserves and Resources
Current mineral reserves and resources (exclusive of reserves) for Lalor and other Snow Lake satellite deposits as of January 1, 2020 are summarized below.
| Lalor Mine Mineral Reserve and Resource Estimates1,2,3,4 |
Tonnes | Cu Grade (%) | Zn Grade (%) | Au Grade (g/t) | Ag Grade (g/t) |
| Base Metal Zone Reserves | |||||
| Proven | 7,276,000 | 0.57 | 6.27 | 2.42 | 29 |
| Probable | 1,739,000 | 0.60 | 4.15 | 3.83 | 31 |
| Gold Zone Reserves | |||||
| Proven | 1,748,000 | 1.37 | 1.11 | 6.70 | 24 |
| Probable | 4,251,000 | 0.83 | 0.42 | 6.21 | 27 |
| Total Proven and Probable | 15,015,000 | 0.74 | 3.77 | 4.16 | 28 |
| Base Metal Zone Resources | |||||
| Inferred | 454,000 | 0.34 | 7.32 | 2.16 | 21 |
| Gold Zone Resources | |||||
| Inferred | 3,945,000 | 1.31 | 0.31 | 4.69 | 26 |
| Total Inferred | 4,399,000 | 1.21 | 1.03 | 4.43 | 26 |
Note: totals may not add up correctly due to rounding.
1 Mineral resources are exclusive of mineral reserves and do not have demonstrated economic viability.
2 Mineral reserves and resources calculated using metal prices of $1.17 per pound zinc (includes premium), $1,375 per ounce gold, $3.10 per pound copper, $17.00 per ounce of silver.
3 Mineral reserves are estimated at an NSR cut-off of $101 per tonne for waste filled mining areas and a minimum of $113 per tonne for paste filled mining areas.
4 Mineral resources are estimated at a minimum NSR cut-off of $101 per tonne.
| Snow Lake Regional Deposits - Gold Mineral Reserve and Resource Estimates |
Tonnes | Cu Grade (%) | Zn Grade (%) | Au Grade (g/t) | Ag Grade (g/t) | |
| Probable Reserves1 | ||||||
| WIM | 2,448,000 | 1.63 | 0.25 | 1.6 | 6.3 | |
| 3 Zone | 662,000 | - | - | 4.2 | - | |
| Total Probable (Gold) | 3,110,000 | 1.28 | 0.20 | 2.2 | 5.0 | |
| Inferred Resources2 | ||||||
| Birch | 569,000 | - | - | 4.4 | - | |
| New Britannia | 2,753,000 | - | - | 4.5 | - | |
| Total Inferred (Gold) | 3,222,000 | - | - | 4.5 | - | |
Note: totals may not add up correctly due to rounding.
1 WIM mineral reserves are estimated at a minimum net smelter return (“NSR”) cut-off of C$150 per tonne, assuming processing recoveries of 98% for copper, 88% for gold and 70% for silver, and using long-term prices of $3.10 per pound copper, $1,375 per ounce gold and $17.00 per ounce silver. 3 Zone mineral reserves are estimated at a minimum NSR cut-off of C$150 per tonne, assuming processing recoveries of 85% for gold, and using a long-term price of $1,375 per ounce gold.
2 Mineral resources are exclusive of mineral reserves and do not have demonstrated economic viability. New Britannia mineral resource estimates have been reported at a minimum true width of 1.5 metres and with a cut-off grade varying from 2 grams per tonne (at the lower part of New Britannia) to 3.5 grams per tonne (at the upper part of New Britannia).
| Snow Lake Regional Deposits – Base Metals Mineral Reserve and Resource Estimates1 |
Tonnes | Cu Grade (%) | Zn Grade (%) | Au Grade (g/t) | Ag Grade (g/t) | |
| Indicated Resources | ||||||
| Pen II | 469,000 | 0.49 | 8.89 | 0.35 | 6.8 | |
| Total Indicated (Base Metals) | 469,000 | 0.49 | 8.89 | 0.35 | 6.8 | |
| Inferred Resources | ||||||
| 1901 | 2,065,000 | 0.25 | 9.67 | 0.87 | 30.3 | |
| Watts | 3,153,000 | 2.34 | 2.58 | 0.95 | 31 | |
| Pen II | 132,000 | 0.37 | 9.81 | 0.3 | 6.9 | |
| Total Inferred (Base Metals) | 5,350,000 | 1.48 | 5.49 | 0.9 | 30.1 | |
Note: totals may not add up correctly due to rounding.
1 Mineral resources are exclusive of mineral reserves and do not have demonstrated economic viability. 1901 mineral resources are estimated at a minimum NSR cut-off of $170 per tonne, assuming processing recoveries of 73% for copper, 94% for zinc, 48% for gold and 47% for silver, and using long-term prices of $3.10 per pound copper, $1,260 per ounce gold, $1.10 per pound zinc and $18.00 per ounce silver. Watts mineral resources are estimated at a minimum NSR cut-off of $150 per tonne, assuming processing recoveries of 87% for copper, 80% for zinc, 65% for gold and 64% for silver, and using long-term prices of $3.10 per pound copper, $1,375 per ounce gold, $1.10 per pound zinc and $17.00 per ounce silver. Pen II mineral resources are estimated at a minimum NSR cut-off of $75 per tonne and assume that the Pen II mineral resources would be amenable to processing at the Stall mill.
Phase Three of Snow Lake Gold Strategy and Exploration Upside
Exploration efforts at the Lalor mine were highly successful in 2019 with the definition of additional mineral resources at Lalor. The updated resource model at Lalor includes 4.4 million tonnes of inferred mineral resources, which have the potential to extend the Lalor mine life beyond the current estimate of ten years. A new copper-gold rich lens, called Lens 17, is included in the updated inferred mineral resource estimate for Lalor. Lens 17 contains an inferred mineral resource of 0.8 million tonnes at 3.0% copper, 3.7 grams per tonne gold and 18 grams per tonne silver. Please refer to Figure 2 for a 3D image of Lens 17, including the location of the drill holes and a conceptual development plan. Lens 17 and other lenses at Lalor, including the copper-gold rich Lens 27, remain open down plunge and offer opportunities to further expand Lalor’s resource base once suitable underground drilling platforms have been established over the next two years.
In addition, the mineral resources at Hudbay’s satellite gold deposits in the Snow Lake region, such as Birch and the New Britannia deposit, could provide feed for the New Britannia processing facilities and further extend the mine life. New Britannia and Birch are mineralized zones at the past producing New Britannia gold mine that would be accessible with some investment in the existing mining infrastructure.
The 1901 deposit is located approximately half-way between the former Chisel North mine and the Lalor mine at a depth between 500 metres to 700 metres and within 1,000 metres of the existing haulage ramp to Lalor. The 1901 deposit could provide additional feed for the processing facilities in Snow Lake. On August 8, 2019, Hudbay published an initial inferred mineral resource estimate for the zinc-rich 1901 deposit discovered six months earlier. Since August 2019, the company has considered various options to develop the 1901 deposit and is completing a drill program aimed at converting a significant portion of the inferred mineral resources to an indicated category and to define an initial inferred mineral resource for the gold mineralization previously intersected between two lenses of zinc-rich mineralization. Hudbay intends to provide an update on the mineral resource estimates and development options for the 1901 deposit with its annual reserve and resource update in March 2021.
The Watts and Pen II deposits present additional opportunities to further optimize the Snow Lake operations. Confirmatory drilling conducted during 2019 at the 100% owned Watts deposit supported an initial inferred mineral resource estimate of approximately 3.2 million tonnes at 2.34% copper, 2.58% zinc, 0.95 grams per tonne gold and 31 grams per tonne silver. The Watts deposit is located approximately 95 kilometres from the Stall concentrator and is in close proximity to roads and power lines. Please refer to Figure 1 for a map of the location of the Watts deposit. Watts was discovered by the company in 1982 with the majority of the drilling being conducted between 1996 and 2008. Considering the available processing capacity at the Stall concentrator and recent drilling successes which expanded the volume of high-grade copper mineralization at Watts, Hudbay is now confident that the potential for economic extraction of the Watts deposit has been established to a level sufficient to report an initial inferred mineral resource estimate.
Pen II is a low tonnage and high-grade zinc deposit that starts from surface and is located within trucking distance of the Stall mill. In 2019, Hudbay defined an indicated resource estimate of 0.5 million tonnes at 8.9% zinc. Pen II could constitute a supplemental source of feed for the Stall mill. Hudbay expects to continue metallurgical testing, infill drilling and technical studies in an attempt to confirm the technical and economic viability of the resource.
In 2020 and 2021, additional technical studies and exploration activities will be conducted to confirm how the Lalor in-mine exploration targets and the regional gold and base metal satellite deposits could be incorporated in the consolidated business plan of the Snow Lake operations.
For additional details on the Lalor mine and the company’s Snow Lake operations, refer to the technical report titled “NI 43-101 Technical Report, Lalor and Snow Lake Operations, Manitoba, Canada”, effective January 1, 2019, which was filed on March 28, 2019 on Hudbay’s profile on SEDAR at www.sedar.com and on EDGAR at www.sec.gov.
777 Mine
Based on the most recent estimate of mineral reserves, the 777 mine life has been extended to the end of the second quarter of 2022.
Current mineral reserves and resources (exclusive of reserves) for 777 as of January 1, 2020 are summarized below.
| 777 Mine Mineral Reserve and Resource Estimates1 |
Tonnes | Cu Grade (%) | Zn Grade (%) | Au Grade (g/t) | Ag Grade (g/t) | |
| Mineral Reserves | ||||||
| Proven | 2,122,000 | 1.44 | 4.55 | 2.01 | 27 | |
| Probable | 459,000 | 1.11 | 4.11 | 1.75 | 26 | |
| Total Proven and Probable | 2,581,000 | 1.38 | 4.47 | 1.96 | 27 | |
| Mineral Resources | ||||||
| Measured | 370,000 | 2.02 | 3.69 | 1.97 | 25 | |
| Indicated | 140,000 | 1.02 | 3.85 | 1.57 | 26 | |
| Total Measured and Indicated | 510,000 | 1.75 | 3.74 | 1.86 | 26 | |
| Inferred | 210,000 | 1.48 | 5.22 | 3.11 | 40 | |
Note: totals may not add up correctly due to rounding.
1 Mineral resources are exclusive of mineral reserves and do not have demonstrated economic viability. Mineral reserves and resources calculated using life-of-mine (2020-2022) average metal prices of $2.92 per pound copper, $1.11 per pound zinc (includes premium), $1,392 per ounce gold, $16.33 per ounce silver and using a C$/US$ exchange rate of 1.30.
Constancia Mine
In 2019, infill drilling and economic re-evaluations have provided the basis to convert measured and indicated mineral resources to mineral reserves which have largely offset 2019 mining depletion. As a result, an additional year has been added and the expected mine life has been maintained at 17 years. Inferred mineral resources have also increased in 2020 due to higher long-term price forecasts in the NSR cut-off value used for reporting.
Current mineral reserves and resources (exclusive of reserves) for Constancia as of January 1, 2020 are summarized below.
| Constancia Mine Mineral Reserve and Resource Estimates1 |
Tonnes | Cu Grade (%) | Mo Grade (g/t) | Au Grade (g/t) | Ag Grade (g/t) | |
| Constancia Reserves | ||||||
| Proven | 408,800,000 | 0.28 | 85 | 0.035 | 2.76 | |
| Probable | 77,500,000 | 0.27 | 70 | 0.044 | 3.58 | |
| Total Proven and Probable - Constancia | 486,300,000 | 0.28 | 83 | 0.036 | 2.89 | |
| Pampacancha Reserves | ||||||
| Proven | 32,400,000 | 0.59 | 178 | 0.368 | 4.48 | |
| Probable | 7,500,000 | 0.62 | 173 | 0.325 | 5.75 | |
| Total Proven and Probable - Pampacancha | 39,900,000 | 0.60 | 177 | 0.360 | 4.72 | |
| Total Proven and Probable | 526,600,000 | 0.30 | 90 | 0.061 | 3.03 | |
| Constancia Resources | ||||||
| Measured | 122,700,000 | 0.18 | 55 | 0.028 | 1.77 | |
| Indicated | 154,300,000 | 0.20 | 65 | 0.033 | 1.87 | |
| Inferred | 83,100,000 | 0.18 | 43 | 0.036 | 3.39 | |
| Pampacancha Resources | ||||||
| Measured | 11,400,000 | 0.41 | 101 | 0.245 | 4.95 | |
| Indicated | 6,000,000 | 0.35 | 84 | 0.285 | 5.16 | |
| Inferred | 10,100,000 | 0.14 | 143 | 0.233 | 3.86 | |
| Total Measured and Indicated | 294,400,000 | 0.20 | 63 | 0.045 | 2.01 | |
| Total Inferred | 93,200,000 | 0.18 | 54 | 0.057 | 3.44 | |
Note: totals may not add up correctly due to rounding.
1 Mineral resources are exclusive of mineral reserves and do not have demonstrated economic viability. Mineral reserves and resources calculated using metal prices of $3.10 per pound copper, $11.00 per pound molybdenum, $17.00 per ounce silver and $1,375 per ounce gold. The Constancia and Pampacancha reserve pits consist of operational pits of proven and probable reserves and are based on metal prices noted, metallurgical recoveries applied by ore type (between 84.4% to 90.5%), and processing costs of $4.54 per tonne milled, general and administrative costs of $1.60 per tonne milled and mining costs of $1.30 and $1.35 per tonne moved (waste and ore, respectively).
Constancia North Drilling
Hudbay completed a drill program of seven holes in December 2019 to test a possible extension of copper porphyry and high-grade skarn mineralization occurring within 300 metres of the edge of the current Constancia pit. The location of the drill holes with respect to the existing Constancia pit is shown in Figure 3. The occurrence of high-grade skarn mineralization in two historical holes drilled in 2007 and 2008 was confirmed with this program, including seven new intersections of copper porphyry and high-grade copper-gold-silver skarn comparable to the mineralization currently mined at Constancia. These intersections warrant further exploration in 2020 to confirm if additional mineral resources could be defined and potentially support an extension of the Constancia pit to the north. Significant historical and recent drill intersections north of the Constancia pit are summarized below.
| Hole ID | From | To | Intercept1 | Cu2,3 | Au2,3 | Ag2,3 |
| (m) | (m) | (m) | (%) | (g/t) | (g/t) | |
| CO-19-306 | 368.0 | 408.6 | 40.6 | 0.52 | 0.79 | 17.89 |
| CO-19-307 | 42.0 | 62.0 | 20.0 | 0.20 | 0.03 | 3.55 |
| CO-19-308 | 35.0 | 57.0 | 22.0 | 0.24 | 0.07 | 2.03 |
| CO-19-310 | 263.0 | 361.0 | 98.0 | 1.10 | 0.08 | 5.93 |
| CO-19-311 | 90.3 | 118.0 | 27.7 | 0.54 | 0.45 | 11.78 |
| CO-20-314 | 73.0 | 100.0 | 27.0 | 0.23 | 0.03 | 16.55 |
| CO-20-315 | 19.0 | 86.0 | 67.0 | 0.31 | 0.00 | 3.28 |
| CO-07-1094 | 305.0 | 348.0 | 43.0 | 1.54 | 0.23 | 3.28 |
| CO-08-2154 top | 24.0 | 59.9 | 35.9 | 0.25 | 0.21 | 11.47 |
| CO-08-2154 bottom | 217.3 | 346.0 | 128.7 | 0.82 | 0.05 | 13.56 |
1 True widths cannot be estimated at this stage given the uncertainties of the skarn mineralization geometry.
2 All copper, gold and silver values are uncut.
3 Specific gravity results are pending - assay results are length weighted.
4 Historical drill results from 2007 and 2008.
| Hole ID | From (m) | To (m) | Azimuth at Intercept | Dip at Intercept | Core Size | ||||
| Easting | Northing | Elevation | Easting | Northing | Elevation | ||||
| CO-19-306 | 200,774 | 8,400,155 | 3,925 | 200,764 | 8,400,152 | 3,886 | 261 | -76 | HQ |
| CO-19-307 | 200,842 | 8,400,371 | 4,235 | 200,837 | 8,400,366 | 4,216 | 227 | -69 | HQ |
| CO-19-308 | 200,850 | 8,400,385 | 4,252 | 200,846 | 8,400,389 | 4,231 | 316 | -75 | HQ |
| CO-19-310 | 200,768 | 8,400,676 | 4,085 | 200,784 | 8,400,647 | 3,993 | 153 | -70 | HQ |
| CO-19-311 | 200,622 | 8,400,633 | 4,240 | 200,632 | 8,400,622 | 4,216 | 140 | -57 | HQ |
| CO-20-314 | 200,826 | 8,400,101 | 4,199 | 200,833 | 8,400,100 | 4,173 | 92 | -75 | HQ |
| CO-20-315 | 200,883 | 8,400,328 | 4,259 | 200,874 | 8,400,316 | 4,194 | 222 | -77 | HQ |
| CO-07-109 | 200,762 | 8,400,618 | 4,055 | 200,777 | 8,400,602 | 4,018 | 135 | -60 | HQ |
| CO-08-215 top |
200,889 | 8,400,237 | 4,256 | 200,877 | 8,400,237 | 4,222 | 270 | -70 | HQ |
| CO-08-215 bottom |
200,827 | 8,400,238 | 4,073 | 200,790 | 8,400,237 | 3,950 | 268 | -73 | HQ |
Constancia Regional Potential
Along with successfully reaching an agreement to acquire the surface rights at Pampacancha, Hudbay has continued to progress its negotiations to conclude community agreements granting exploration access to the past producing Caballito property and the highly prospective Maria Reyna and Kusiorcco properties. In 2019, Hudbay concluded an agreement with the Collana Vellile community for exploration access to two exploration targets located less than 10 kilometres southwest of the Constancia mine and has initiated baseline and exploration/technical activities required to access and conduct drilling on these properties. Also, after reaching an exploration agreement with the Quehuincha community in early 2019 and subsequently completing the required Consult Previa process, the company has obtained a drill permit to test a high-grade skarn target on the Quehuincha North property located 11 kilometers to the north of Constancia. Please refer to Figure 4 for a map highlighting the location of the regional targets within trucking distance to the Constancia mine and processing facilities.
Other Development Assets
Rosemont is a copper development project, located in Pima County, Arizona, approximately 50 kilometres southeast of Tucson. The Rosemont project is expected to be an open pit, shovel and truck operation and has an expected 19-year mine life. There were no changes to Rosemont’s reserves and resources during 2019. In the first half of 2019, Rosemont received the Section 404 Water Permit from the U.S. Army Corps of Engineers and the U.S. Forest Service (“USFS”) approved Rosemont’s Mine Plan of Operations (“MPO”) following an extensive Environmental Impact Statement process. The issuance of the MPO was the final administrative step in the permitting process. On July 31, 2019, the U.S. District Court for the District of Arizona (“Court”) issued a ruling in two of the lawsuits challenging the U.S. Forest Service’s issuance of the Final Record of Decision (“FROD”) for the Rosemont project (the “US Mining Law Litigation”). The Court ruled to vacate and remand the FROD thereby delaying the expected start of construction of Rosemont. In December of 2019, Hudbay and the U.S. Department of Justice each filed a notice of appeal in respect of the Court’s decision in the US Mining Law Litigation to the U.S. Ninth Circuit Court of Appeals. Hudbay expects the appeals process to take approximately two years and remains committed to evaluating all options to advance the Rosemont project.
The Mason project is a large greenfield copper deposit located in the historic Yerington District of Nevada and is one of the largest undeveloped copper porphyry deposits in North America. The Mason project’s measured and indicated mineral resources have not changed over the past year and are comparable in size to Constancia and Rosemont. Hudbay views the Mason project as a long-term option for potential future development and a strong addition to its pipeline of long-term growth opportunities. In the fourth quarter of 2019, Hudbay acquired a prospective package of patented and unpatented mining claims contiguous to the Mason project. The land package, known as the Mason Valley properties, is an exploration stage project that includes past producing mines and has the potential to provide additional mineral resources to the Mason project. The company has also entered into an option agreement to acquire an 80% interest in the Gray Hills unpatented mining claims in Lyon County, Nevada, located approximately 25 kilometres southeast of the Mason project, as part of its land consolidation strategy in the Yerington district.
Corporate Update
As announced on March 20, 2020, the company initiated a temporary and orderly shutdown of operations at Constancia after the Peruvian government declared a state of emergency causing the manufacturing and transport of critical mining supplies to be restricted. The state of emergency in Peru has since been extended until April 12, 2020. A smaller workforce has been maintained at Constancia to oversee critical aspects of the operation, with the overarching goal of facilitating a quick and efficient ramp up back to normal levels once the regional situation improves.
In Manitoba, Hudbay’s mines continue to operate and ship concentrate and zinc metal. The team is actively engaging with its employees, contractors and the local communities to manage the evolving situation and is implementing its business preparedness plan, including planning activities in the event the company needs to reduce or cease operations or construction activities in the future. The company’s focus is on maintaining business continuity and a safe environment for its workers and the communities.
Hudbay continues to prudently manage its liquidity position and currently has approximately $300 million in cash and cash equivalents. The company proactively amended its credit facilities in February 2020 to provide additional near-term flexibility and is evaluating a variety of liquidity and capital spending options if the current environment persists. The company has the ability to defer a majority of its 2020 growth capital expenditures at Pampacancha and the New Britannia gold mill. The company will continue to monitor the macro-environment and the status of its operations to assess the potential impacts on its annual guidance disclosure and expects to provide an update with its first quarter results.
The company also acknowledges that on March 23, 2020, Fitch Ratings has assigned a first-time Long-Term Issuer Default Rating of ‘B+’ to Hudbay and Hudbay Peru S.A.C., a 'BB+'/'RR1' rating to the company's senior secured revolving credit facilities and a 'B+'/'RR4' rating to the unsecured notes, and a “stable” outlook on its rating.
Non-IFRS Financial Performance Measures
Cash cost and sustaining and all-in sustaining cash cost per ounce of gold produced are shown because the company believes they help investors and management assess the performance of its Snow Lake operations, including the margin generated by the operations and the company. Unit operating costs are shown because the measures are used by the company as a key performance indicator to assess the performance of its mining and processing operations. These measures do not have a meaning prescribed by IFRS and are therefore unlikely to be comparable to similar measures presented by other issuers. These measures should not be considered in isolation or as a substitute for measures prepared in accordance with IFRS and are not necessarily indicative of operating profit or cash flow from operations as determined under IFRS. Other companies may calculate these measures differently. For further details on these measures, including reconciliations of historical unit operating costs and cash costs per pound of copper produced to the most comparable IFRS measures, please refer to page 42 of Hudbay’s management’s discussion and analysis for the three and twelve months ended December 31, 2019 available on SEDAR at www.sedar.com and footnote “iv” to this news release.
Qualified Person
The scientific and technical information contained in this news release related to the Constancia mine and Rosemont project has been approved by Cashel Meagher, P. Geo, Hudbay’s Senior Vice President and Chief Operating Officer. The scientific and technical information related to the company’s other material mineral projects contained in this news release has been approved by Olivier Tavchandjian, P. Geo, Hudbay’s Vice-President, Exploration and Geology. Messrs. Meagher and Tavchandjian are qualified persons pursuant to NI 43 101. For a description of the key assumptions, parameters and methods used to estimate mineral reserves and resources at Hudbay’s material properties, as well as data verification procedures and a general discussion of the extent to which the estimates of scientific and technical information may be affected by any known environmental, permitting, legal title, taxation, sociopolitical, marketing or other relevant factors, please see the technical reports for the company’s material properties as filed by Hudbay on SEDAR at www.sedar.com.
Additional details on the company’s material properties, including a year-over-year reconciliation of reserves and resources, is included in Hudbay's Annual Information Form for the year ended December 31, 2019, which is available on SEDAR at www.sedar.com.
Note to United States Investors
This news release has been prepared in accordance with the requirements of the securities laws in effect in Canada, which differ from the requirements of United States securities laws.
Canadian reporting requirements for disclosure of mineral properties are governed by the Canadian Securities Administrators’ National Instrument 43-101 Standards of Disclosure for Mineral Projects (“NI 43-101”). Subject to the SEC Modernization Rules described below, the United States reporting requirements are currently governed by the United States Securities and Exchange Commission ("SEC") Industry Guide 7 (“SEC Industry Guide 7”) under the Securities Act of 1933, as amended.
The definitions used in NI 43-101 are incorporated by reference from the Canadian Institute of Mining, Metallurgy and Petroleum (“CIM”) – Definition Standards adopted by CIM Council on May 10, 2014 (the “CIM Definition Standards”). For example, the terms “mineral reserve”, “proven mineral reserve” and “probable mineral reserve” are Canadian mining terms as defined in NI 43-101, and these definitions differ from the definitions in SEC Industry Guide 7. Furthermore, while the terms “mineral resource”, “measured mineral resource”, “indicated mineral resource” and “inferred mineral resource” are defined in and required to be disclosed by NI 43-101, these terms are not defined terms under SEC Industry Guide 7.
Under SEC Industry Guide 7 standards, a “final” or “bankable” feasibility study is required to report reserves and the primary environmental analysis or report must be filed with the appropriate governmental authority. Further, under SEC Industry Guide 7, mineralization may not be classified as a “reserve” unless the determination has been made that the mineralization could be economically and legally produced or extracted at the time the reserve determination is made. Reserve estimates contained in this news release may not qualify as “reserves” under SEC Industry Guide 7. Further, until recently, the SEC has not recognized the reporting of mineral deposits which do not meet the SEC Industry Guide 7 definition of “reserve”.
The SEC adopted amendments to its disclosure rules to modernize the mineral property disclosure requirements for issuers whose securities are registered with the SEC under the Securities Exchange Act of 1934, as amended. These amendments became effective February 25, 2019 (the “SEC Modernization Rules”) with compliance required for the first fiscal year beginning on or after January 1, 2021. The SEC Modernization Rules replace the historical disclosure requirements for mining registrants that were included in SEC Industry Guide 7, which will be rescinded from and after the required compliance date of the SEC Modernization Rules. As a result of the adoption of the SEC Modernization Rules, the SEC now recognizes estimates of "measured mineral resources", "indicated mineral resources" and "inferred mineral resources". In addition, the SEC has amended its definitions of "proven mineral reserves" and "probable mineral reserves" to be “substantially similar” to the corresponding CIM Definition Standards, incorporated by reference in NI 43-101.
United States investors are cautioned that while the above terms are “substantially similar” to CIM definitions, there are differences in the definitions under the SEC Modernization Rules and the CIM Definition Standards. Accordingly, there is no assurance any mineral reserves or mineral resources that the Company may report as "proven mineral reserves", 'probable mineral reserves", "measured mineral resources", "indicated mineral resources" and "inferred mineral resources" under NI 43-101 would be the same had the Company prepared the reserve or resource estimates under the standards adopted under the SEC Modernization Rules.
United States investors are also cautioned that while the SEC will now recognize "measured mineral resources", "indicated mineral resources" and "inferred mineral resources", investors should not assume that any part or all of the mineralization in these categories will ever be converted into a higher category of mineral resources or into mineral reserves. Mineralization described using these terms has a greater amount of uncertainty as to their existence and feasibility than mineralization that has been characterized as reserves. Accordingly, investors are cautioned not to assume that any "measured mineral resources", "indicated mineral resources", or "inferred mineral resources" that the Company reports are or will be economically or legally mineable.
Further, "inferred mineral resources" have a greater amount of uncertainty as to their existence and as to whether they can be mined legally or economically. Therefore, United States investors are also cautioned not to assume that all or any part of the "inferred mineral resources" exist. In accordance with Canadian rules, estimates of "inferred mineral resources" cannot form the basis of feasibility or other economic studies, except in limited circumstances where permitted under NI 43-101.
For the above reasons, information contained in this news release containing descriptions of the Company’s mineral deposits may not be comparable to similar information made public by United States companies subject to the reporting and disclosure requirements under the United States federal securities laws and the rules and regulations thereunder.
Forward-Looking Information
This news release contains forward-looking information within the meaning of applicable Canadian and United States securities legislation. All information contained in this news release, other than statements of current and historical fact, is forward-looking information. Often, but not always, forward-looking information can be identified by the use of words such as “plans”, “expects”, “budget”, “guidance”, “scheduled”, “estimates”, “forecasts”, “strategy”, “target”, “intends”, “objective”, “goal”, “understands”, “anticipates” and “believes” (and variations of these or similar words) and statements that certain actions, events or results “may”, “could”, “would”, “should”, “might” “occur” or “be achieved” or “will be taken” (and variations of these or similar expressions). All of the forward-looking information in this news release is qualified by this cautionary note.
Forward-looking information includes, but is not limited to, production, cost and capital and exploration expenditure guidance and potential revisions to such guidance, anticipated production at the company’s mines and processing facilities, expectations regarding the impact of the COVID-19 pandemic on our operations, financial condition and prospects, expectations regarding the timing of mining activities at the Pampacancha deposit, the anticipated timing, cost and benefits of developing the Rosemont project and the outcome of litigation challenging Rosemont's permits, expectations regarding the Lalor gold strategy, including the refurbishment of the New Britannia mill, and the possibility of optimizing the value of the gold resources in Manitoba, the future potential of the 1901 deposit, including the possibility of identifying additional gold resources, the possibility of converting inferred mineral resource estimates to higher confidence categories, the potential and the company’s anticipated plans for advancing its mining properties surrounding Constancia and the Mason project, anticipated mine plans, anticipated metals prices and the anticipated sensitivity of the company’s financial performance to metals prices, events that may affect the operations and development projects, anticipated cash flows from operations and related liquidity requirements, the anticipated effect of external factors on revenue, such as commodity prices, estimation of mineral reserves and resources, mine life projections, reclamation costs, economic outlook, government regulation of mining operations, and business and acquisition strategies. Forward-looking information is not, and cannot be, a guarantee of future results or events. Forward-looking information is based on, among other things, opinions, assumptions, estimates and analyses that, while considered reasonable by the company at the date the forward-looking information is provided, inherently are subject to significant risks, uncertainties, contingencies and other factors that may cause actual results and events to be materially different from those expressed or implied by the forward-looking information.
The material factors or assumptions that Hudbay identified and were applied by the company in drawing conclusions or making forecasts or projections set out in the forward-looking information include, but are not limited to:
- the duration of the state of emergency in Peru and the company's ability to resume operations at Constancia;
- no significant interruptions to the company's operations in Manitoba or significant delays to its development projects in Manitoba and Peru due to the COVID-19 pandemic;
- the availability of spending reductions and liquidity options;
- the timing of development and production activities on the Pampacancha deposit;
- the timing of the Consulta Previa and permitting process for mining the Pampacancha deposit;
- the timing for reaching additional agreements with individual community members and no significant unanticipated delays to the development of Pampacancha;
- the successful completion of the New Britannia project on budget and on schedule;
- the successful outcome of the Rosemont litigation;
- the success of mining, processing, exploration and development activities;
- the scheduled maintenance and availability of the company’s processing facilities;
- the accuracy of geological, mining and metallurgical estimates;
- anticipated metals prices and the costs of production;
- the supply and demand for metals the company produces;
- the supply and availability of all forms of energy and fuels at reasonable prices;
- no significant unanticipated operational or technical difficulties;
- the execution of the company’s business and growth strategies, including the success of its strategic investments and initiatives;
- the availability of additional financing, if needed;
- the ability to complete project targets on time and on budget and other events that may affect the company’s ability to develop its projects;
- the timing and receipt of various regulatory and governmental approvals;
- the availability of personnel for the exploration, development and operational projects and ongoing employee relations;
- maintaining good relations with the labour unions that represent certain of the company’s employees in Manitoba and Peru;
- maintaining good relations with the communities in which the company operates, including the neighbouring Indigenous communities;
- no significant unanticipated challenges with stakeholders at the company’s various projects;
- no significant unanticipated events or changes relating to regulatory, environmental, health and safety matters;
- no contests over title to the company’s properties, including as a result of rights or claimed rights of Indigenous peoples or challenges to the validity of the company’s unpatented mining claims;
- the timing and possible outcome of pending litigation and no significant unanticipated litigation;
- certain tax matters, including, but not limited to current tax laws and regulations and the refund of certain value added taxes from the Canadian and Peruvian governments; and
- no significant and continuing adverse changes in general economic conditions or conditions in the financial markets (including commodity prices and foreign exchange rates).
The risks, uncertainties, contingencies and other factors that may cause actual results to differ materially from those expressed or implied by the forward-looking information may include, but are not limited to, risks associated with the COVID-19 pandemic and its effect on our operations, projects, financial condition and prospects, the political situation in Peru, risks generally associated with the mining industry, such as economic factors (including future commodity prices, currency fluctuations, energy prices and general cost escalation), uncertainties related to the development and operation of the company’s projects (including risks associated with the litigation affecting the Rosemont project), risks related to the U.S. district court's recent decisions to set aside the U.S. Forest Service's FROD and the Biological Opinion for Rosemont and related appeals and other legal challenges, risks related to the new Lalor mine plan, including the schedule and cost for the refurbishment of the New Britannia mill and the ability to convert inferred mineral resource estimates to higher confidence categories, risks related to the schedule for mining the Pampacancha deposit (including risks associated with COVID-19, the Consulta Previa process, risks associated with reaching additional agreements with individual community members and risks associated with the rainy season in Peru, and the impact of any schedule delays), dependence on key personnel and employee and union relations, risks related to political or social unrest or change, risks in respect of Indigenous and community relations, rights and title claims, operational risks and hazards, including the cost of maintaining and upgrading the company’s tailings management facilities and any unanticipated environmental, industrial and geological events, the inability to insure against all risks, failure of plant, equipment, processes, transportation and other infrastructure to operate as anticipated, compliance with government and environmental regulations, including permitting requirements and anti-bribery legislation, depletion of the company’s reserves, volatile financial markets that may affect the company’s ability to obtain additional financing on acceptable terms, the failure to obtain required approvals or clearances from government authorities on a timely basis, uncertainties related to the geology, continuity, grade and estimates of mineral reserves and resources, and the potential for variations in grade and recovery rates, uncertain costs of reclamation activities, the company’s ability to comply with its pension and other post-retirement obligations, the company’s ability to abide by the covenants in its debt instruments and other material contracts, tax refunds, hedging transactions, as well as the risks discussed under the heading “Risk Factors” in the company’s most recent Annual Information Form.
Should one or more risk, uncertainty, contingency or other factor materialize or should any factor or assumption prove incorrect, actual results could vary materially from those expressed or implied in the forward-looking information. Accordingly, you should not place undue reliance on forward-looking information. The company does not assume any obligation to update or revise any forward-looking information after the date of this news release or to explain any material difference between subsequent actual events and any forward-looking information, except as required by applicable law.
About Hudbay
Hudbay (TSX, NYSE: HBM) is a diversified mining company primarily producing copper concentrate (containing copper, gold and silver) and zinc metal. Directly and through its subsidiaries, Hudbay owns three polymetallic mines, four ore concentrators and a zinc production facility in northern Manitoba and Saskatchewan (Canada) and Cusco (Peru), and copper projects in Arizona and Nevada (United States). The company’s growth strategy is focused on the exploration, development, operation and optimization of properties it already controls, as well as other mineral assets it may acquire that fit its strategic criteria. Hudbay’s vision is to be a responsible, top-tier operator of long-life, low-cost mines in the Americas. Hudbay’s mission is to create sustainable value through the acquisition, development and operation of high-quality, long-life deposits with exploration potential in jurisdictions that support responsible mining, and to see the regions and communities in which the company operates benefit from its presence. The company is governed by the Canada Business Corporations Act and its shares are listed under the symbol "HBM" on the Toronto Stock Exchange, New York Stock Exchange and Bolsa de Valores de Lima. Further information about Hudbay can be found on www.hudbay.com.
For investor and media inquiries, please contact:
Candace Brûlé
Director, Investor Relations
(416) 814-4387
candace.brule@hudbay.com
Figure 1: Snow Lake Location Map is available at https://www.globenewswire.com/NewsRoom/AttachmentNg/fcb0ea38-13d6-47ea-a7b3-15e1a98be28e
Location of Snow Lake regional deposits, existing mines, processing mills and transportation infrastructure.
Figure 2: Lalor Potential Mine Life Extension is available at https://www.globenewswire.com/NewsRoom/AttachmentNg/b5c04b5c-f2ff-481b-be7f-5a6d9852ccf4
3D view of Lens 17 proposed development and potential Lalor mine life extension.
Figure 3: Drilling North of the Constancia Pit is available at https://www.globenewswire.com/NewsRoom/AttachmentNg/d9dfc780-f36d-4f81-8b9c-50f6ea10247a
3D view of drilling north of the current Constancia reserve and resource pit shells. The black lines represent drill holes without significant mineralized intersections.
Figure 4: Constancia Regional Targets is available at https://www.globenewswire.com/NewsRoom/AttachmentNg/ebf41d73-3eb7-4446-94e8-ccd7dac5bcc4
Map of the exploration targets located within trucking distance to the Constancia mine and processing facilities.
_______________
i Life-of-mine gold metal contained in concentrate and doré starting in year 2020.
ii Based on S&P Global’s 2020 all-in sustaining cost curve.
iii Average annual gold production of 152,768 ounces from 2022 to 2029 in the new mine plan compared to average annual gold production of 140,800 ounces from 2022 to 2026 in the previous mine plan.
iv Sustaining cash cost per ounce of gold produced, net of by-product credits, is a non-IFRS financial performance measure with no standardized definition under IFRS. Sustaining cash cost includes all operating (mining, milling and G&A) and sustaining capital costs associated with Lalor and Snow Lake gold production and is reported net of by-product credits. By-product credits are based on the following assumptions: zinc price (including premium) of $1.18 per pound in 2020, $1.08 per pound in 2021 and 2022, and $1.17 per pound long-term; copper price of $2.65 per pound in 2020, $3.00 per pound in 2021, and $3.10 per pound in 2022 and long-term; silver price of $16.00 per ounce in 2020, $16.50 per ounce in 2021 and 2022, and $17.00 per ounce long-term; C$/US$ exchange rate of 1.30 in 2020 and long-term.
![]()
Figure 1: Snow Lake Location Map
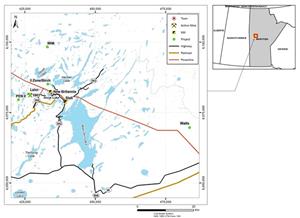
Location of Snow Lake regional deposits, existing mines, processing mills and transportation infrastructure.
Figure 2: Lalor Potential Mine Life Extension
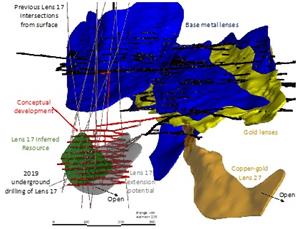
3D view of Lens 17 proposed development and potential Lalor mine life extension.
Figure 3: Drilling North of the Constancia Pit
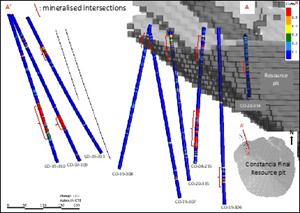
3D view of drilling north of the current Constancia reserve and resource pit shells. The black lines represent drill holes without significant mineralized intersections.
Figure 4: Constancia Regional Targets
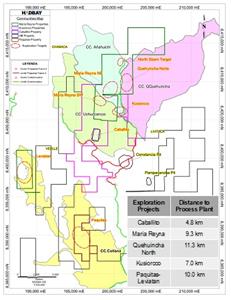
Map of the exploration targets located within trucking distance to the Constancia mine and processing facilities.
EIN Presswire does not exercise editorial control over third-party content provided, uploaded, published, or distributed by users of EIN Presswire. We are a distributor, not a publisher, of 3rd party content. Such content may contain the views, opinions, statements, offers, and other material of the respective users, suppliers, participants, or authors.